
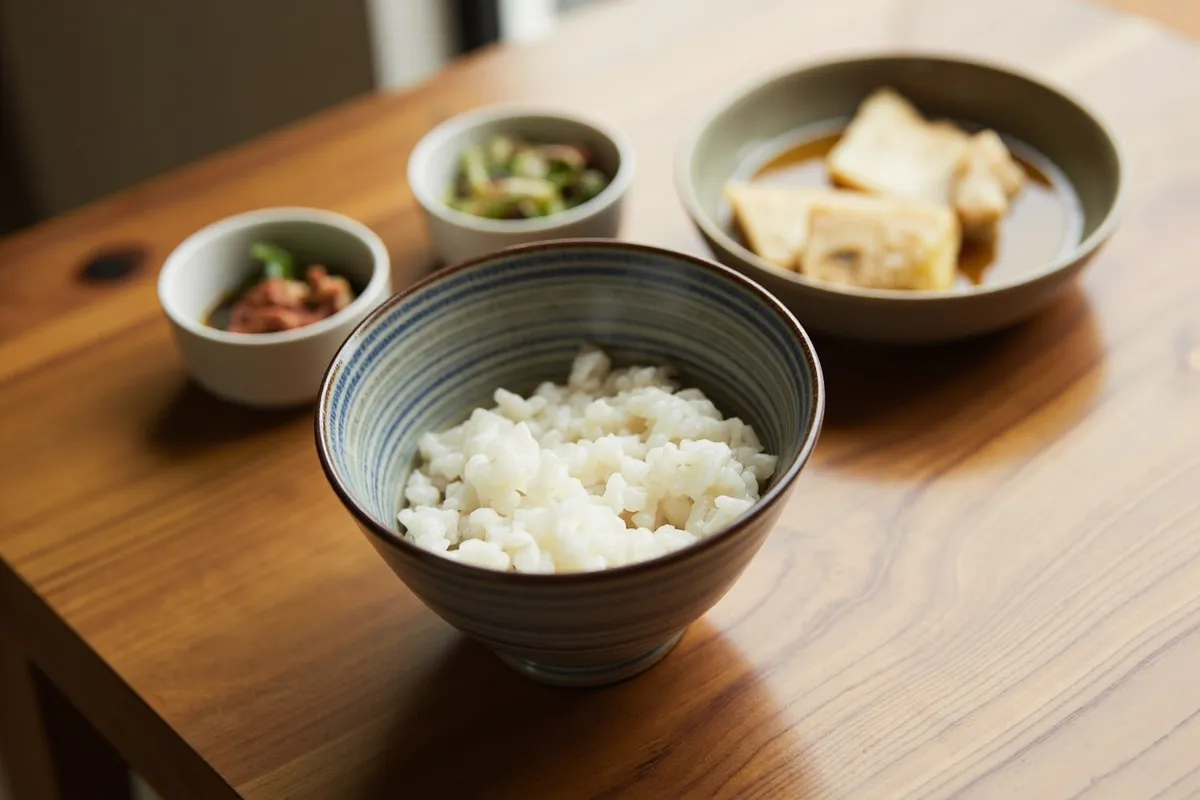
Hara hachi bu is the Okinawan rule of stopping a meal when your stomach is about 80% full, and it is the closest thing most people get to a diet from a book about Japanese eating. The phrase has a Confucian paper trail back to 1713; the version people actually use is a sentence Okinawan elders repeat before they start eating – hara hachi bun me, finish at eight parts. So what does eating to 80% full actually do? Mostly one thing: it nudges you into eating a bit less without a spreadsheet. Whether that turns into weight loss depends on what happens around it, and the honest version is more interesting than the sales pitch.
One thing first, because getting it wrong is worse than not doing it at all. If you take insulin, gliclazide or glimepiride, or you have a history of an eating disorder, talk to your doctor or a registered dietitian before you start a rule built around stopping early – the reasoning sits in the limits section further down, and it is not a footnote. I have cooked this way in pieces since my grandmother's table in Yokohama and my own kitchen in Manchester, and the two-week test at the end is how I would check whether it suits you. No predictions about your weight, because the studies cannot give me any.
What it actually does: lowers daily intake by roughly 10–20% depending on how well you execute it, and gives you a stopping rule instead of a food list.
What it does not do: speed up your metabolism, and the ritual itself has never been put through a controlled trial of its own.
Who it suits: people who want one small repeatable change and can eat three times a day – not anyone on glucose-lowering medication without a clinician.
What Is Hara Hachi Bu? Origins, Meaning and the Okinawan Context
The Confucian roots: Yojokun (1713) and the Okinawan saying
Let me start with the paperwork, because the popular version drops it and the paperwork is where the meaning lives. Hara hachi bu (腹八分) is a Confucian-derived saying from Okinawa: roughly, finish your stomach at eight parts out of ten. It has a written ancestor in Yojokun (養生訓), a health manual published in 1713 by Kaibara Ekiken, and the elder Okinawan form of it is something people recite before a meal rather than a food list handed out with the soup. The modern gym version drops the sentence and keeps the number, which is why the phrase now turns up in most gyms with almost no context attached.
Kaibara Ekiken, Yojokun, 1713: don't make your stomach full and reduce meat in diet, walk after the meal and don't sit at one place for long time.
One detail from my own table, because it explains more than the dictionaries do. My grandmother never said the number 80% out loud. She served rice in a bowl that was simply too small for seconds and put the serving dishes in the middle of the table where everybody could reach. The instruction was in the crockery.
| Version | What it says | What it actually asks for |
|---|---|---|
| Yojokun, 1713 | Do not fill your stomach; cut back on meat; walk after eating | A smaller meal and more movement, both |
| Household saying | Hara hachi bun me – finish at eight parts | A stopping rule at the table, said out loud |
| Gym version | Eat to 80% full | The same stopping rule with the context dropped |
So the rule is behavioural, not nutritional. It is not a meal plan and it is not a medical protocol. The Japanese state later moved responsibility for a healthy lifestyle into the sphere of law and administration, and it still runs lifestyle-related health check-ups for people aged 40–74 on public insurance, but that is background, not proof that the saying works.
Eating until 80% full: what the rule means on the plate
Now the part where people usually want a number, so let me be precise about what the number is and is not. Eat until 80% full means stopping while part of your stomach's capacity is still free. You leave the last bites of rice, you are not stuffed, you are not reaching for more. It is a felt state, and there is no scale that validates a precise 80% threshold. Nobody has calibrated one, and the phrase was never meant as a measurement.
Two things I would put in bold for anyone quoting this at you. First, 80% describes stomach capacity, not calories. The two are not interchangeable, and the gap between them is where most of the marketing lives. Second, fullness arrives through several signals at once: how long you chewed, how much your stomach stretched, and gut hormones such as cholecystokinin and GLP-1. Treat those as the operative cue, not a stopwatch. The famous 20-minute wait before deciding you are full is a useful practical pause, but it is not a measured physiological constant, and I would stop anyone selling it as one.
| The saying | What it means in practice | What it does not mean |
|---|---|---|
| Hara hachi bun me | Stop with part of your capacity unused | A fixed portion size in grams |
| Eat until 80% full | Leave the last bites, no seconds | A guaranteed 20% cut in calories |
| Follow the elders | Notice fullness cues and act on them | A validated appetite test |
My own checklist, which lives next to the hob and is a behavioural translation rather than a validated instrument:
- You still want the rice; you just do not need it.
- You can walk away from the table comfortably.
- You are not stuffed or uncomfortable.
- Your hand is not reaching for more.
- You would happily eat the same meal again in an hour.
The one-line version: stop while part of your stomach is still free, and treat 80% as a feeling rather than a measurement.
The Okinawan longevity context: centenarians, Blue Zones and a shrinking advantage
The context matters, because the habit came out of a population that lived differently from us. The Okinawa Centenarian Study, running since 1975, has interviewed and examined more than 1,000 centenarians, about a third of them functionally independent. Its data show that in a typical city of 100,000 inhabitants, roughly three times fewer males and more than four times fewer females would die of coronary heart disease in a year than in a comparable American city.
Blue Zones adds the longevity framing: Okinawans over 65 have a life expectancy of about 84 for men and close to 90 for women, with roughly a fifth the cardiovascular disease rate and under half the dementia rate of similarly aged Americans. The Okinawan diet behind those numbers was built around sweet potato instead of polished white rice, plus tofu, miso soup, kombu seaweed and mugwort used in place of salt. Much of the Japanese food and health research in this field comes out of that study.
| Signal | Figure | What it cannot show |
|---|---|---|
| Centenarians studied | More than 1,000 interviewed and examined since 1975; about a third functionally independent | That any single food caused it |
| Coronary heart disease | About 3 times fewer male and 4 times plus fewer female deaths a year in a city of 100,000 than a comparable US city | That it was the 80% rule and not genes, income or healthcare |
| Life expectancy over 65 | About 84 for men, close to 90 for women | That a modern reader elsewhere gets the same numbers |
And the part the study's own authors keep repeating: the advantage is shrinking. Younger Okinawans are trading the traditional plate for processed and fast food high in sodium and saturated fat, and car use is cutting daily movement. That caveat is the reason this is not a sales page, and it is also why the calorie and trial evidence below matters more than the anecdotes.
Does Hara Hachi Bu Work? Evidence From Okinawans and Clinical Trials
What the Okinawan calorie data actually shows
Here are the numbers people quote, and the arithmetic nobody does. Okinawans ate about 1,900 calories a day on average. The average American man consumes over 2,500, peaking at 2,692 in his forties; the average American woman 1,766. So the headline gap against a man in his forties is roughly a quarter of his intake.
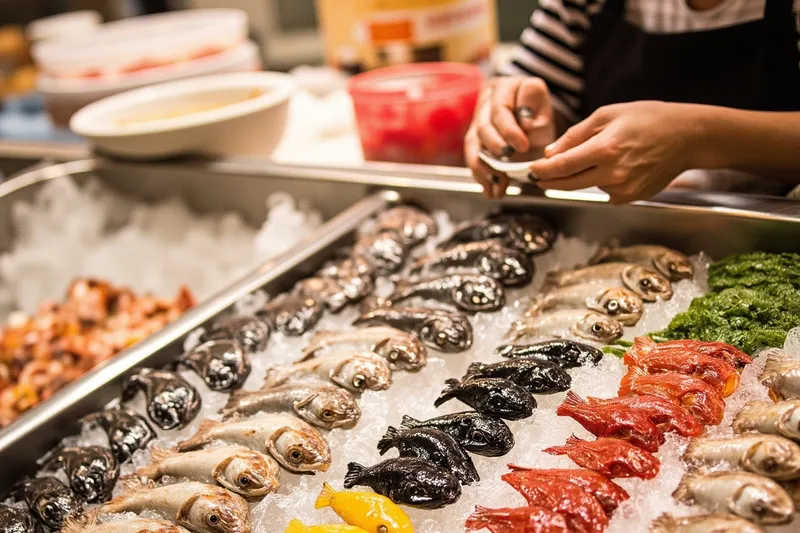
There is a second, quieter figure and it is the one I trust more: before the 1960s, Okinawans are estimated to have eaten 10–15% fewer calories than calorie guidelines normally require. That is the closest quantified version of the hara hachi bu diet in the historical record, and it is smaller than the 20% people assume.
Here is the honest bit. Those two numbers use different denominators. 1,900 against 2,500 compares two populations; 10–15% compares against guideline requirements. They are not the same claim and you cannot average them. The assumption everybody makes – that 80% of your stomach equals 20% fewer calories – is an assumption, not a finding. Stomach capacity and energy are different currencies, and when people eat more slowly they usually take in less food but not exactly a fifth less energy. I would be suspicious of any article that tells you the number is 20%.
| Who | Average daily intake | Measured against |
|---|---|---|
| Okinawan average | About 1,900 kcal | Nothing – a population average |
| Okinawans before the 1960s | 10–15% below guideline requirements | Recommended intake at the time |
| American man, average | Over 2,500 kcal | Nothing – a population average |
| American man, in his forties | Peak 2,692 kcal | Nothing – a population average |
| American woman, average | 1,766 kcal | Nothing – a population average |
And note what kind of evidence this is: population averages observed, not a controlled trial. People in a place eat a certain way for reasons that have nothing to do with one sentence spoken before dinner.
Calorie restriction in controlled trials: the CALERIE results
For the actual test, this is the strongest evidence in the article, and it comes with a warning label: it is not a trial of hara hachi bu. In the CALERIE trial, 218 healthy adults aged 21–50 with a BMI of 22.0–27.9 were randomised 2:1 to a 25% calorie-restriction diet or an unrestricted control. The restriction group achieved a mean cut of 11.9% (2,467 down to 2,170 kcal a day) and a sustained 7.5 kg weight loss over two years, against a 0.1 kg gain in the controls. Seventy-one percent of that lost mass was fat.
The cardiometabolic panel moved too: LDL cholesterol, the ratio of total to HDL cholesterol, and both systolic and diastolic blood pressure fell significantly, while C-reactive protein (p=0.012) and insulin sensitivity (p<0.0001) improved against control. People often describe CALERIE as proof that hara hachi bu works. It is not, and the distinction matters. Participants chose their own food and had instruction and monitoring. The ritual of stopping early is one way to deliver a deficit; it is not an intervention with a mechanism of its own.
| Result over two years | Restriction group | How to read it |
|---|---|---|
| Weight | 7.5 kg loss (controls: 0.1 kg gain) | Group means, not your number |
| Share of loss that was fat | 71% | Share of the mass lost, not 71% of you |
| Daily intake | 2,467 to 2,170 kcal (mean 11.9% cut) | Less than the 25% the protocol allowed |
| LDL and total-to-HDL ratio | Both down significantly | About the deficit, not the ritual |
| Blood pressure | Systolic and diastolic down | Same caveat |
| CRP and insulin sensitivity | p=0.012 and p<0.0001 | Same caveat |
What CALERIE does not test: it did not include people living with obesity; 25% is not 20%; the food was freely chosen rather than ritual portions; and two years is not a lifetime. Still, the group that restricted more lost more and the group that restricted less did not. That is the whole mechanism argument in one sentence.
The mechanism: eating rate, slow eating and portion control
Why does the same plate produce different intake depending on speed? Because fullness is a process and you can outrun it. In a randomised crossover study of 70 adults, eating slowly lowered meal energy density and eating rate in both normal-weight and overweight or obese participants, and reduced hunger ratings in both groups. The significant cut in meal energy intake showed up in the normal-weight participants (804.5 vs 892.6 kcal, p=0.04) and not in the participants with overweight or obesity (667.3 vs 724.8 kcal, p=0.18). Read that carefully if your main problem is excess weight: slowing down on its own may not be enough for you.
Small bowls do the same job by narrowing the choice before hunger shows up – a smaller rice bowl, side dishes portioned out, soup in a little bowl. I like the mechanism, but I would not sell it as a result. The evidence on tableware size and intake is thinner than the sales pages suggest, so I treat small plates as a nudge rather than a lever. The pause before topping up is a practical slow-down device, not a measured delay between stomach and brain: satiation involves oral processing time and bite size, gastric distension, and gut hormones such as cholecystokinin and GLP-1. No peer-reviewed source fixes a 20-minute constant.
One nice thing about the original text. The Yojokun line pairs the smaller meal with movement – walk after the meal and don't sit at one place for long time. So the traditional pairing is less food and more walking, which is also the half most modern write-ups leave out.
My slow-eating protocol: eat seated, one dish at a time; pause between courses; no screen; finish with a protein or a vegetable; wait before topping up and ask whether you actually want more.
The Hara Hachi Bu Diet: What to Eat
The ichiju sansai plate and the geometry of small portions
The plate that makes this workable is a serving convention, not a diet device, and I want to be clear about that. The traditional washoku plate is one bowl of rice, one bowl of soup and three side dishes drawn from the sea and the forest. Nothing about it is calibrated to 80% fullness. It simply makes stopping early the default, because the rice portion is small by default, there is no seconds culture, and the soup and small sides occupy space before the rice bowl is finished.
It also predates any dieting talk by a couple of centuries. The structure was built around fish, vegetables and fermentation, and the plate was assembled in the middle of the table and shared – my grandmother's arrangement, unchanged.
| Component | Typical volume (my own rough guide) | Role on the plate | Easy swap |
|---|---|---|---|
| Rice | About 150–200 g cooked, one small bowl | Carbohydrate, not the centrepiece | Half konjac shirataki, or extra greens |
| Soup | One small bowl, roughly 250 ml | Volume and warmth at the start | Any low-salt broth |
| Three sides | Two or three tablespoons each | Vegetable, protein and fermentation | Pick two of them; nobody counts |
Those volumes are my own kitchen approximations, not official Japanese portions – treat them as a starting shape rather than a chart. If you want real numbers, per-item energy and protein figures live in the Japanese food composition tables.
My five swaps that reproduce most of the effect: konjac shirataki or extra greens in place of half the rice; a small bowl of miso first; no rice refills; side dishes eaten before the rice; tea between courses. And one household problem worth naming, because it kills most attempts: this rule has to survive other people's plates. Take your own portion first, keep your own bowl, and do not negotiate seconds.
Plant-forward staples: tofu, miso, seaweed and sweet potato, and what the 2025–2030 guidelines now say
Why these four? Sweet potato rather than polished white rice is a lower-energy, higher-fibre carbohydrate, and it takes up more room on the plate. Tofu and soy give you protein with a low saturated-fat load. Miso soup adds water, salt and flavour to the start of the meal, which is a cheap way to fill space. Kombu and nori seaweed add volume and minerals for very little energy. The logic is volume and protein, not magic.
The official backdrop arrived in January 2026, when the Dietary Guidelines for Americans 2025–2030 came out with the tagline eat real food. For adults they set daily servings of 3 vegetables, 2 fruits and 2–4 whole grains, and they raise the protein recommendation to 1.2–1.6 g per kg of body weight per day, 50–100% more than the previous minimum – I turn that into a per-meal number in the protein section rather than repeat it here. Two changes matter for this way of eating: added sugars are capped at no more than 10 g in any one meal, replacing the old 10%-of-calories limit, and parents are told to keep children off added sugars until age 10 rather than age 2.
One honest tension, since the new pyramid graphic puts steak, whole milk and butter in the foreground while the cap on saturated fat stays at 10% of daily calories. Both things are in the same document, and you do not have to pick a winner to follow it sensibly.
| Staple | Energy and protein (rough kitchen estimate) | Role | Cheapest version |
|---|---|---|---|
| Firm tofu, 100 g | About 110–130 kcal and 10–12 g protein | Protein anchor | Own-brand block |
| Miso soup, one bowl | About 40–70 kcal | Volume and salt at the start | Own-brand paste |
| Sweet potato, 150 g | About 130 kcal | Slow carbohydrate | Seasonal and cheap |
| Kombu or nori | Minimal calories | Volume and minerals | Dried pack |
Protein anchor options, with serving sizes I would not defend to the gram: tofu, fish, eggs, natto, edamame, and plain yoghurt if you eat dairy.
Reading a Japanese nutrition label: per-item energy and protein figures live in the Japanese food composition tables. Match the food, not the label shape – a block of tofu and a tub of tofu have wildly different numbers.
One caution. Kombu and other kelp vary enormously in iodine content, and large amounts every day can be a thyroid problem for some people. If seaweed is a daily habit rather than a garnish, ask your doctor how much is reasonable for you.
Low-calorie drinks and fillers: mugicha, matcha, konjac shirataki
The drinks are the quiet part of the practice. Roasted mugicha barley tea is a non-caloric table drink in the warm months, matcha and green tea give you caffeine and volume with almost no energy, and konjac shirataki is a near-zero-calorie noodle that adds texture to a bowl without adding much. I use all three and none of them replaces protein, fibre or micronutrients. They are tools for the 80% rule, not a diet.
The reason this section matters is the opposite case. The 10 g cap on added sugars per meal is what makes sweetened tea, juice and fizzy drinks the quiet way this rule gets broken – nobody logs liquid calories, because a glass of juice does not feel like eating. The other half is coffee, where I would keep an eye on timing rather than pretend I have the answer. The research on caffeine and appetite is thinner than the marketing.
| Drink or filler | Serving | Calories | What it does | What it cannot replace |
|---|---|---|---|---|
| Mugicha barley tea | One cold glass | None | Fills the glass between courses | Anything nutritional |
| Matcha or green tea | One cup | Minimal | Volume plus caffeine | Hydration is still water's job |
| Konjac shirataki | One small portion | Almost none | Bulk in a bowl | Protein or fibre |
When the rule feels hard, my answer is hot mugicha or hojicha between courses, sparkling water with the meal, and tea instead of a second serving of rice. If you want the long read on the green tea side, I wrote Green Tea and Matcha: Benefits, Research and How to Use Them at some point and clearly did not remember writing it.
Building a Hara Hachi Bu Routine That You Can Keep
Fasting windows vs. continuous restriction vs. calorie counting
Three protocols work. Continuous energy restriction – a daily cut – is the easiest to sustain and the best supported. Time-restricted eating, the 16:8 window, compresses the eating day. Intermittent fasting sits beside it. The definitions used in current diet reviews are worth having straight: intermittent fasting means repeated fasting periods of 48 hours or less, and time-restricted eating means a daily fasting window of at least 14 hours.
Head to head, the difference is small. A meta-analysis finds about 0.94 kg of extra weight loss for intermittent fasting over roughly six months, with the gap narrowing in studies longer than six months. That is under a kilo, averaged, and it is not a mechanism change – the same deficit administered differently. So on intermittent fasting vs calorie counting, the honest answer is that they are close to equals, and the one that suits your week wins.
This is where I would push back on the usual framing. Hara hachi bu is a stopping rule, not a clock, so it belongs in the first column, not the fasting column. Skipping breakfast is not automatically a better version of this; plenty of people are simply hungry by eleven and eat more by six.
| Protocol | How it works | Daily effort | Evidence | Best fit |
|---|---|---|---|---|
| Continuous restriction | Every day slightly less | Low once you know your target | Strongest | Most people |
| Time-restricted eating (16:8) | Eating window of at least 14 hours | Medium – one rule, two meals | Good | People whose evenings are the problem |
| Intermittent fasting | Fasting periods of 48 hours or less, repeated | Medium to high | About the same, slightly ahead | People who like structure |
And the practical bit nobody publishes: as your weight falls, your energy needs fall with it, so a daily target set once at the start quietly disappears. I recalculate every four to six weeks and would do the same rather than chase a shrinking deficit. That interval is my own rule of thumb, not a guideline.
Protein per meal, muscle mass and the older-adult risk
The main criticism of just eat less is fair. Without enough protein and some resistance activity, part of what you lose is lean tissue rather than fat. CALERIE is the useful benchmark: 71% of the lost mass was fat, which is better than most self-directed dieting, and it happened with instruction and monitoring rather than pure self-restraint.
The official number moved recently. The 2025–2030 guidelines raise the protein recommendation for adults to 1.2–1.6 g per kg of body weight per day, 50–100% more than the previous minimum. My working split of 25–35 g per meal across three meals is my own heuristic rather than a published recommendation, but it is a sensible way to use the official range and it is what I aim for. Protein plus resistance activity is what protects muscle mass retention during a deficit, and it matters more as you get older, because sarcopenia risk in older adults climbs with age. Your own needs depend on your age, mass, activity and health, so treat 1.2–1.6 g/kg as a floor to discuss with a professional, not a target for every body.
| Body weight | Daily target (1.2–1.6 g/kg) | Per-meal split (my own guide) | Sources |
|---|---|---|---|
| 55 kg | 66–88 g | 25–30 g | Tofu, eggs, fish, milk |
| 70 kg | 84–112 g | 28–35 g | Add natto or edamame |
| 85 kg | 102–136 g | 30–35 g | Mix of plant and animal |
My protein per meal checklist: miso plus tofu in one bowl; a fish portion about the size of your palm; two eggs; some soy daily; dairy if you drink it; and protein at breakfast, which is the bit that usually goes wrong. A bowl of rice with nothing on it is not a protein meal.
Weight loss is not fat loss only. In CALERIE, 71% of the mass lost was fat; the rest was lean tissue, and that share grows if protein and resistance work are missing.
One more conversation to have with a doctor rather than with me. If you take a GLP-1 medication such as semaglutide or tirzepatide, your appetite is already being suppressed, so an extra rule about stopping at 80% can push intake lower than is sensible. Ask your prescriber before you add it.
Tracking fullness: apps, food logging and a satiety scale
The awkward question behind all of this: how do you know you stopped at 80%? Three levels, and they are not equal in effort. Level one is no tracking at all – plate geometry only, and the least work. Level two is a photo or a one-line note per meal plus a fullness rating from 1 to 10 on a simple satiety scale. Level three is full calorie counting with a calorie counting app.
The tool landscape, without me endorsing anybody: one app does barcode scanning and keeps a database of more than one million foods on a free tier, while the paid tier is $10.99 a month if you pay monthly or $59.99 a year, which works out at $4.99 a month billed annually. Those were the prices in October 2026, and paid tiers change, so look again before you sign up. For most readers I would skip level three. Logging burden is the single biggest reason people quit, and the most informative cheap metric is not calories but your fullness rating before and after the meal.
| Method | Effort | What it reveals | Typical failure mode |
|---|---|---|---|
| Plate geometry only | None | Whether the shape of the meal works for you | No feedback at all |
| One-line log plus 1–10 fullness rating | 30 seconds a meal | Patterns in hunger and comfort | Drifting after a fortnight |
| Full calorie counting in an app | Several minutes a day | Exact intake | You quit, and feel you failed |
The 10-second fullness check before you top up: am I breathing comfortably, do I still want that last bite, and would I order this again in an hour?
Measure the plate, not only the scale. A scale tells you about water; the plate tells you about behaviour.
Limits, Risks and Who Should Not Copy This
Risks of undereating: low blood sugar, muscle loss and nutrient gaps
This is the part I would not skip. Low blood sugar mainly affects people with diabetes who take insulin or medicines such as gliclazide and glimepiride. NHS guidance on low blood sugar lists missing or delaying meals, and not eating enough carbohydrate, as risk factors, and its advice is not to skip or delay meals. In plain numbers, low blood sugar is blood glucose below 4 mmol/L, it is rare in people without diabetes, and the NHS advises rechecking your blood sugar 10–15 minutes after taking fast-acting carbohydrate. A rule that tells you to stop before you are full, combined with a skipped or delayed meal, is exactly the pattern those medicines make dangerous.
If you take insulin, gliclazide or glimepiride, read this before you start. Do not skip or delay meals, and do not change doses without the person who prescribed them. The rule has to be adapted so that carbohydrate-containing foods still arrive at the times your treatment expects.
Then the general risks of chronic undereating, which are slower and easier to ignore: loss of lean mass, micronutrient gaps, worse training tolerance, rebound eating, and over the long run reduced bone density. People who have had an eating disorder, or who binge regularly, should talk to a clinician before adopting any rule built around control and stopping, because the pattern of restriction and rebound can reinforce itself.
Red flags to stop and who to contact: dizziness, shakiness, repeated night hunger, hair loss, falling strength, flat mood, missed periods, daytime sleepiness. Speak to your GP or a registered dietitian; NHS weight management support runs in most areas, with referral rules that vary locally. Anyone on a GLP-1 medicine needs the same conversation with their prescriber, because appetite is already suppressed and stacking another limit on top is a bad idea.
Why the evidence does not transfer cleanly
Four reasons the 1970s Okinawa story is not your starting point. The advantage is shrinking as industrialised food and cars replace the old pattern. Japan is not a low-obesity society now – the Japan obesity rate is 3.8% for women and 4.5% for men at BMI 30 or above. The eating-speed effect on intake did not reach significance in participants with overweight or obesity, so a Japanese eating habit for weight loss is not automatically a weight-loss intervention for you. And population correlation is not causation: the original observations are ecological, with genes, income and healthcare all tangled in there.
Compare that with where you are starting. In the United States, 40.3% of adults aged 20 and over had obesity in the 2021–2023 NHANES data, including 9.7% with severe obesity, with 31.7% in the overweight band. In Canada, 68% of adults aged 18–79 were overweight or living with obesity in 2022–2024, up from 60% in 2016–2019, and obesity alone rose from 25% to 33%. Half of Canadian adults were above the abdominal-obesity waist threshold – over 102 cm for men, over 88 cm for women – with 55% of women and 42% of men over the line. The fastest rise was in the youngest group: obesity in adults aged 18–39 went from 22% to 33% for men and 17% to 29% for women.
| Country | Overweight and obesity | Waist data | Where it is rising fastest |
|---|---|---|---|
| United States | 40.3% obesity, 9.7% severe, 31.7% overweight (NHANES 2021–2023) | – | – |
| Canada | 68% overweight or living with obesity (2022–2024); obesity 25% to 33% | 49% above threshold; 55% of women, 42% of men | Adults 18–39: men 22% to 33%, women 17% to 29% |
| Japan | 3.8% of women and 4.5% of men at BMI 30+ | – | – |
The tradition has a policy side too. Since 2002 Japan has made healthy-lifestyle responsibility a legal and administrative matter, it passed a basic shokuiku food education law in 2005, and it started lifestyle-related health check-ups for public insurance subscribers aged 40–74 in April 2008. Small plates, soup first and no seconds work as habits; they work as a weight-loss method only if they end up in a deficit.
Making It Work on a Real Budget: Prices, Support and Alternatives
What the staples cost: food inflation and the weekly grocery budget
The cost question deserves real numbers rather than invented ones, so here is what is measurable. In the United States, food prices as a whole were 2.5% higher in the year to September 2026, with food at home up 1.8% and food away from home up 3.5%, and the USDA Food Price Outlook forecasts food-at-home prices up 2.3% for 2026 within a 1.9–2.7% interval, with fresh vegetables up 5.8% and eggs down 29.3%. In Australia, food and non-alcoholic beverage prices were 3.0% higher in the 12 months to August 2026, and meals out and takeaway food rose 4.1%. In the United Kingdom, food and non-alcoholic beverage inflation was 1.3% in the 12 months to July 2026, down from 1.7% a month earlier, with food prices 30.1% above April 2022.
On spending, the UK's household food statistics put the average person at £32.30 a week on household food and non-alcoholic drinks in FYE 2024, 3.2% more in real terms than FYE 2023, and £47.19 a week on all food and drink including eating out. Two caveats: that is per person rather than per household, and FYE 2024 is roughly two years old, so it is the oldest number here and not today's basket.
And the honest limit: there is no reliable shelf-price list for tofu, miso and nori across these countries, so any basket quoted at a fixed price is an illustration rather than a quote. Supermarket prices for tofu and miso are also the line that decides a weekly grocery budget more than the headline inflation figures do. In Canada the monthly CPI release of 19 October 2026 is the fixed point, and item-level detail lives in Statistics Canada's Table 18-10-0004-03, Food, plus the monthly average retail price table for selected food products – and in practice, compare the shelf prices in your own supermarket.
| Country | Latest headline | What is moving | Who publishes it |
|---|---|---|---|
| United States | Food 2.5% higher year on year (year to September 2026) | Food at home 1.8%, food away from home 3.5%; fresh vegetables forecast up 5.8%, eggs down 29.3% | USDA ERS |
| United Kingdom | Food and non-alcoholic drinks 1.3% in the year to July 2026 | Food 30.1% above April 2022 | ONS |
| Australia | Food 3.0% in the year to August 2026 | Meals out and takeaway 4.1% | ABS |
| Canada | Monthly CPI released 19 October 2026 | Item detail in Table 18-10-0004-03 | Statistics Canada |
My own weekly basket, as an illustration and not a price list: tofu, a block of miso, sweet potatoes, a pack of dried kombu or nori, eggs, and whatever vegetables are in season. Tofu and eggs carry the protein, sweet potato and seasonal veg carry the bulk, and the expensive items on Japanese-shop shelves – bonito flakes, premium miso, good dried seaweed – are the ones you can skip without breaking the method. Seasonal produce prices move; that is the line that decides the budget, not the speciality items.
UK readers: NHS support, walking programmes and cheap high-protein staples
UK-specific execution starts with the free stuff. The NHS Couch to 5K walking plan and its app cost nothing, run for nine weeks with three sessions a week and rest days in between, and the NHS advises speaking to a GP first if you are worried about your health before starting any exercise plan. That last point is not a formality at 55 or at 65.
There is a neat piece of continuity here. The Yojokun line itself couples a smaller meal with movement: walk after the meal and don't sit at one place for long time. So walking more is not a modern fitness import bolted onto a Japanese habit – it is in the original sentence, and it is the half most write-ups about hara hachi bu drop. A smaller intake plus more daily movement was the traditional pairing.
On money, the figures from the previous section apply: 1.3% food inflation in the year to July 2026, food prices 30.1% above April 2022, and per-person weekly spending of £32.30 for household food and non-alcoholic drinks, £47.19 including eating out. The NHS also runs local weight-management services, with referral routes and eligibility that vary by area, so ask your GP what is available near you. Readers in the United States, Canada and Australia have national equivalents doing the same job; the 80% rule itself is culture-neutral, only the support network changes.
Start walking: nine weeks, three sessions a week, rest days between. The app handles the plan; the free part is deciding to begin.
Protein on a tight budget, in the order I would buy it: eggs, tofu, tinned fish, frozen vegetables, dried seaweed. Do not spend on the shiny Japanese imports until the basics are automatic.
Alternatives and comparisons: Mediterranean, DASH, and what to do if the pantry does not fit
Put the practice in context with the two patterns that carry longer outcome evidence. The Mediterranean diet and the DASH diet have more trial and outcome data behind them than hara hachi bu, and both overlap heavily with the Japanese pattern – fish, vegetables, soy, fermented foods, little processed meat. The 2025–2030 US guidance I covered earlier, eat real food plus the sugar and saturated-fat caps, aligns with this rather than replacing it.
Be precise about what that means. There are no head-to-head trials of hara hachi bu against either pattern, and to my knowledge the ritual itself has never been put through a controlled trial of its own. So the honest statement is that nobody has shown an advantage either way, not that the other two have proved themselves superior on risk markers. What CALERIE showed was falls in LDL cholesterol, blood pressure and insulin sensitivity under a 25% deficit. That is evidence about the deficit, not about the ritual.
| Pattern | Structure | What it controls | Strongest point | Hardest part |
|---|---|---|---|---|
| Mediterranean-style | Vegetables, legumes, olive oil, fish, modest dairy | Long-term adherence | Outcome data | Olive oil and fish at supermarket prices |
| DASH | Vegetables, fruit, low-fat dairy, less salt | Blood pressure | Clear structure | Milk and fruit volume |
| Hara hachi bu | Small portions, soup first, stop early | Portion discipline | Low effort, no food list | The weakest evidence of the three |
If the Japanese pantry does not fit your household, your budget or your local shop, the transferable parts are structural and they come from anywhere: one protein anchor, one vegetable, soup or another glass of water at the start of the meal, no seconds, slow eating. Swap tofu for beans or eggs, miso for any low-salt broth, kombu for a splash of vinegar, sweet potato for any root vegetable. Do not stack two restrictive frameworks at once, either – one rule at a time, with enough protein and enough food, is the version that survives.
What Hara Hachi Bu Does and Does Not Do: An Honest Summary
The evidence, summarised honestly
So, does hara hachi bu work? As a cultural technique for eating slightly less with less fuss, it is plausible and consistent with what restriction trials show. As an independently tested diet, no: to my knowledge the ritual itself has never been put through a controlled trial, and the benefits in CALERIE came from a sustained calorie deficit. It is a delivery mechanism with a good story attached, and that is worth having.
What it does well: lowers daily intake somewhere between the historical 10–15% and the often-claimed 20%, depending on how well you execute it – and the top of that range is an assumption, not a finding. It cuts down on conflict at the table, gives you structure with a reason that is easier to keep than a spreadsheet, and fits a plant-forward plate that is affordable. What it does not do: speed up your metabolism, unlock a unique fat-burning mechanism, or show a demonstrated edge over Mediterranean-style or DASH eating on risk markers. Its effect through eating speed alone is weaker in people with overweight or obesity. And the Okinawan advantage is shrinking in real time, which weakens the story that carries it.
What it needs: a protein floor, some resistance work, a diet that fits your household and budget, and a medical conversation if you use glucose-lowering medication. And I will not promise you kilograms. The trial figures are group means, and I cannot turn a group mean into your number any more than I can promise that the first fortnight is where the change happens.
The bottom line: hara hachi bu is a low-effort, well-priced little rule for eating slightly less. It works because less food works, not because 80% has a secret.
A two-week way to test it
The lowest-risk way to find out whether it suits you is two weeks, not a lifetime. Week one is geometry only: one rice serving, soup first, three small sides, pauses between courses, no second helpings, no screens at the table – using the ichiju sansai plate and the slow-eating protocol from earlier sections rather than rereading them. Rate your fullness from 1 to 10 after each meal, and record weight and waist once a week, same time, same morning.
Week two keeps the geometry and adds one variable: either a 16:8 eating window or a 10–20% cut in daily intake, logged with an app or a one-line note, plus three 30-minute brisk walks a week. If you are starting from scratch on movement, the nine-week Couch to 5K is the alternative. One variable at a time is the whole point. Changing the plate, the schedule and the calories in week one tells you nothing.
Then decide with a rule rather than a mood: keep it if your waist and your fullness ratings improve and the meal still feels good at the end of it; stop and seek advice if the ratings show constant hunger, weakness, or symptoms of low blood sugar. And do not be alarmed if the scale drops fast in the first one to two weeks – some of that is fluid rather than fat, and a fast start is not proof that the method is exceptional.
Every price and index figure here is the latest official release available at the time of writing: US figures from the USDA ERS Food Price Outlook, Australian figures from the ABS consumer price index, UK inflation from the ONS release for July 2026 with spending data for FYE 2024, and Canada's monthly CPI of 19 October 2026. The UK weekly spending figure is the oldest number in the article, and produce prices move with the season. Several numbers are my own working estimates rather than official figures – portion volumes, energy and protein values, the per-meal protein split, the four-to-six-week recalculation and the early water-loss expectation. This is not medical advice, and any change to insulin or medication belongs with the person who prescribes it. If something here is wrong, tell me and I will fix it.
Before you start, five checks:
- Talk to your prescriber if you take insulin, gliclazide, glimepiride or a GLP-1 medicine, before you start stopping meals early.
- Talk to a dietitian first if you have a history of an eating disorder or repeated bingeing.
- Treat my portion volumes and energy estimates as kitchen approximations, and check per-item figures against the Japanese food composition tables or USDA FoodData Central.
- In Canada, check Statistics Canada's Table 18-10-0004-03 and the monthly average retail price table for selected food products, then compare your own supermarket shelf prices for tofu and miso.
- Stop and see a clinician if dizziness, shakiness, repeated night hunger or falling strength show up in the first weeks, and ask your GP about NHS weight-management referral, where local eligibility rules apply.